Adriana Peña
AI Strategy

Reimagining AI Assistance

Six AI features, built independently over three years. No shared strategy, no coherent system. This is how we changed that.

Role

Lead Designer

Company

Oracle

Year

2025

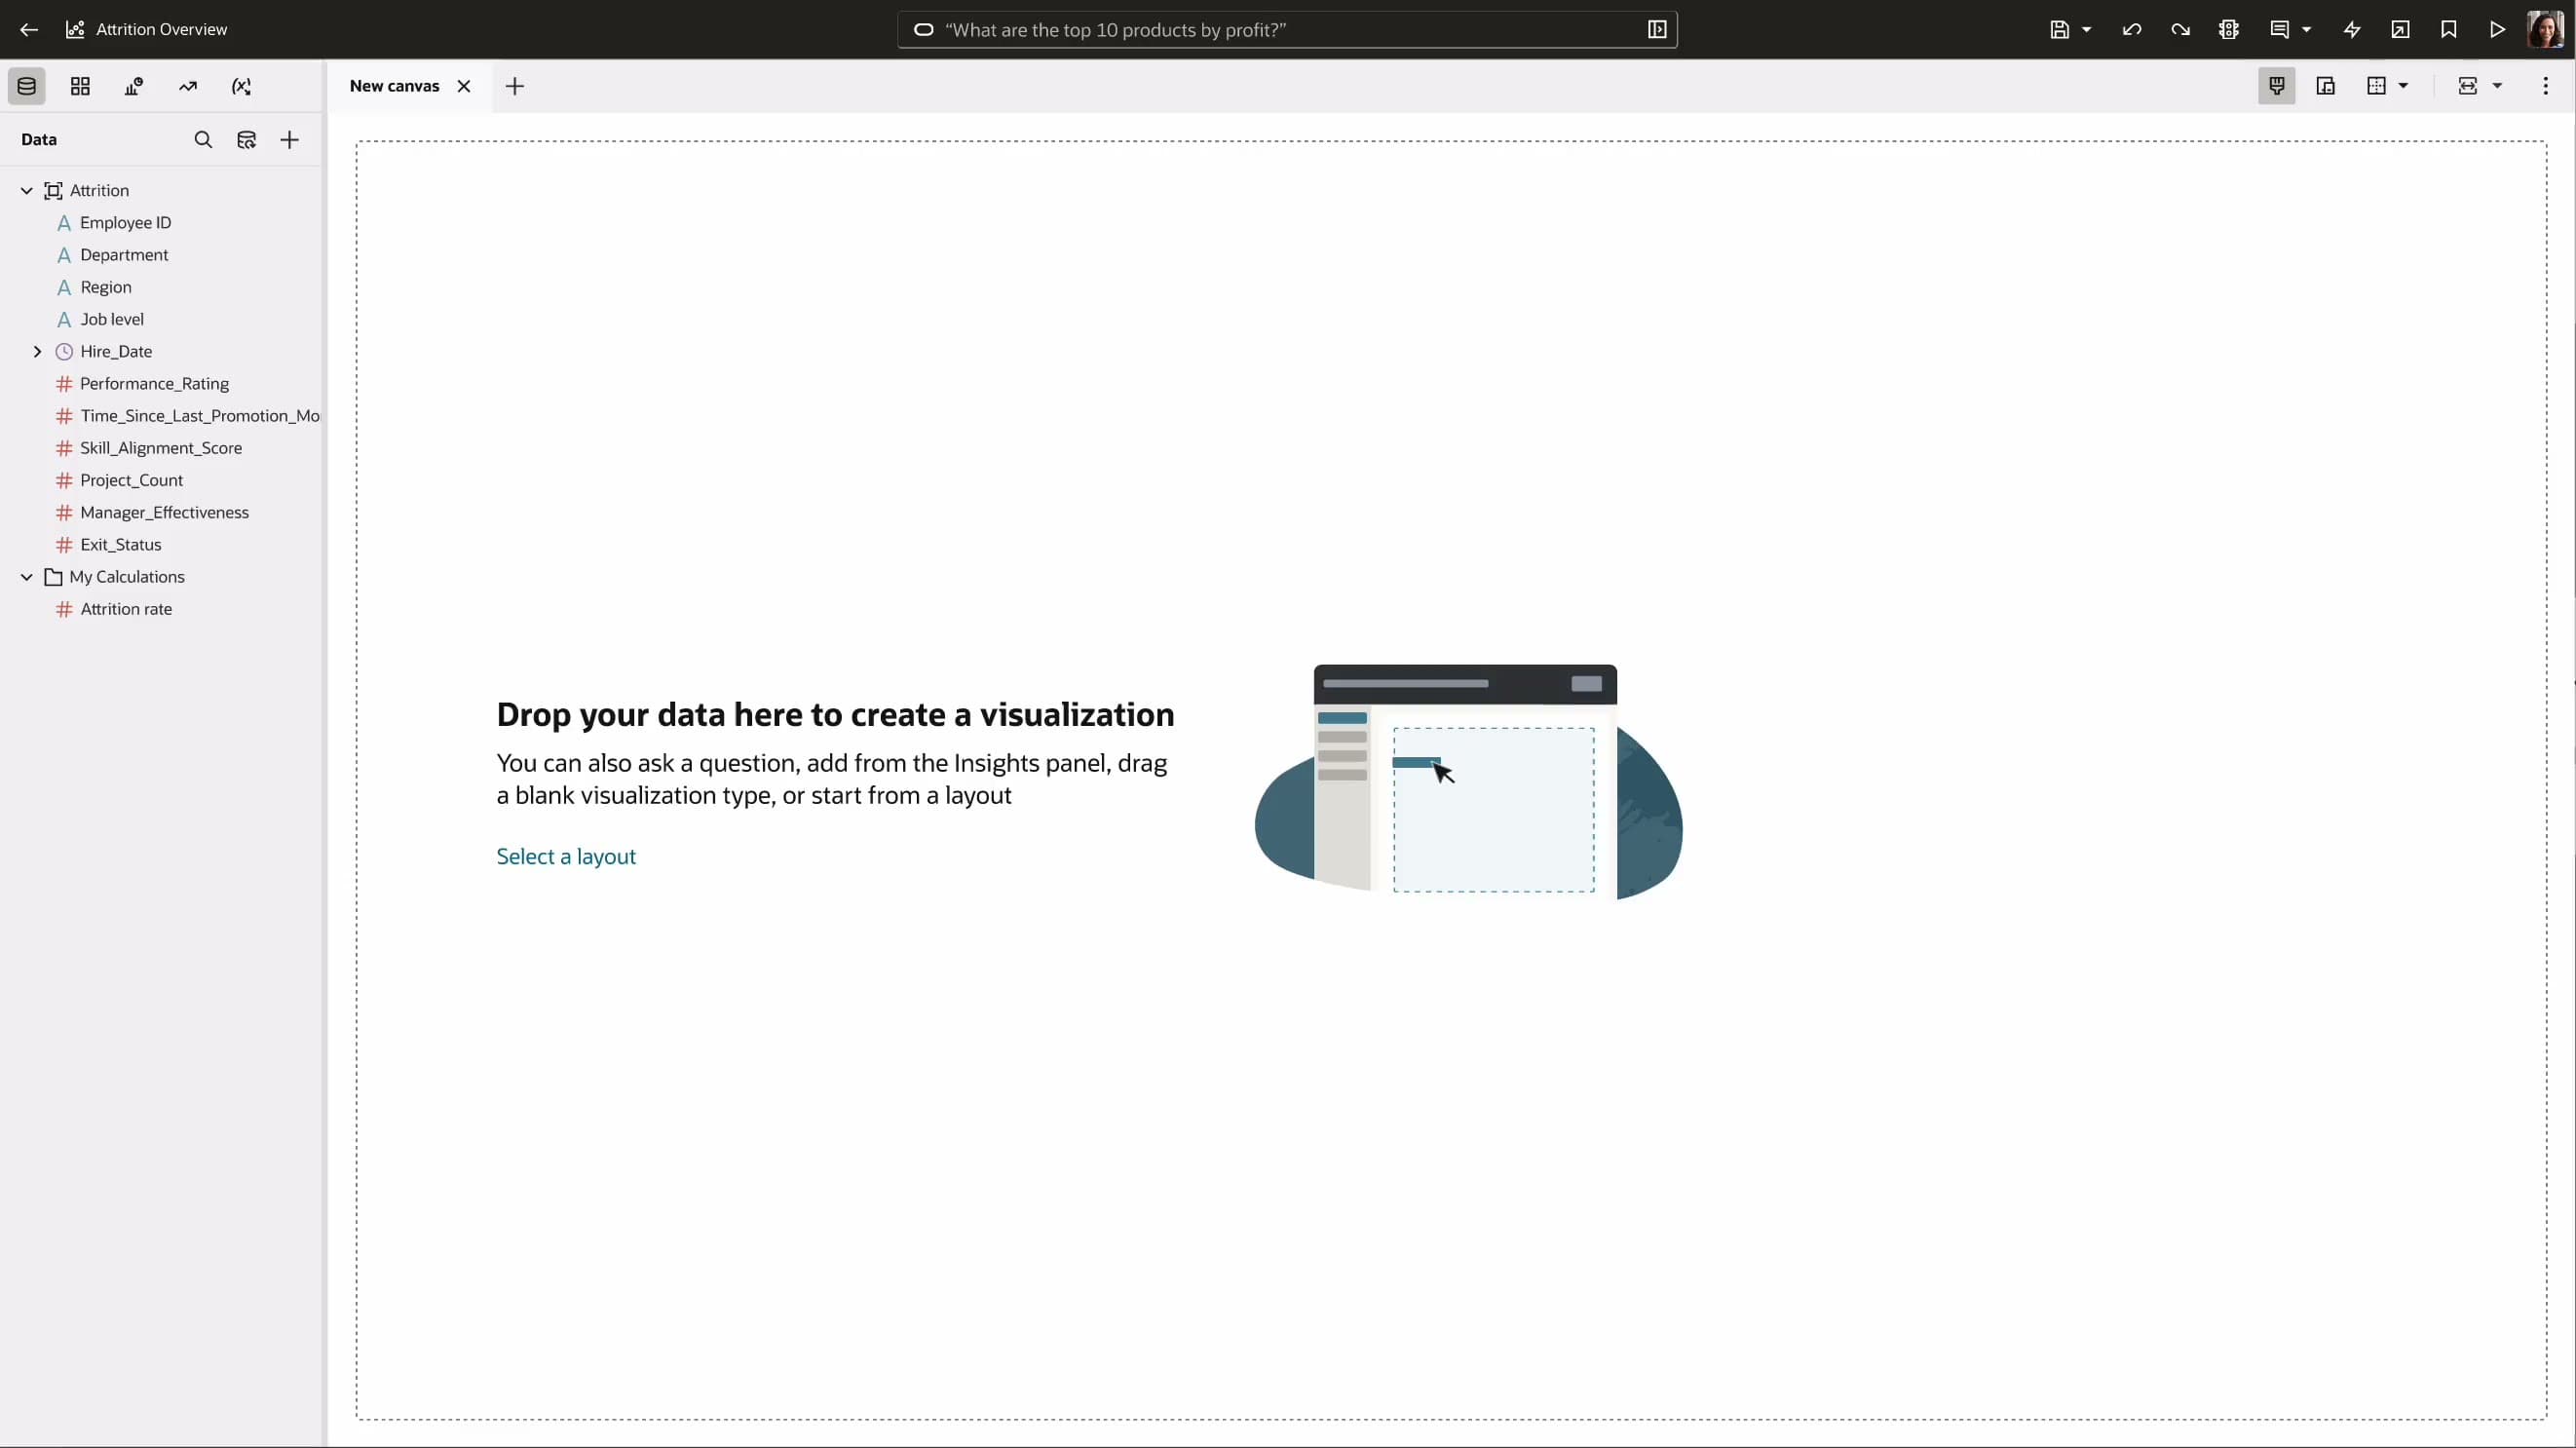
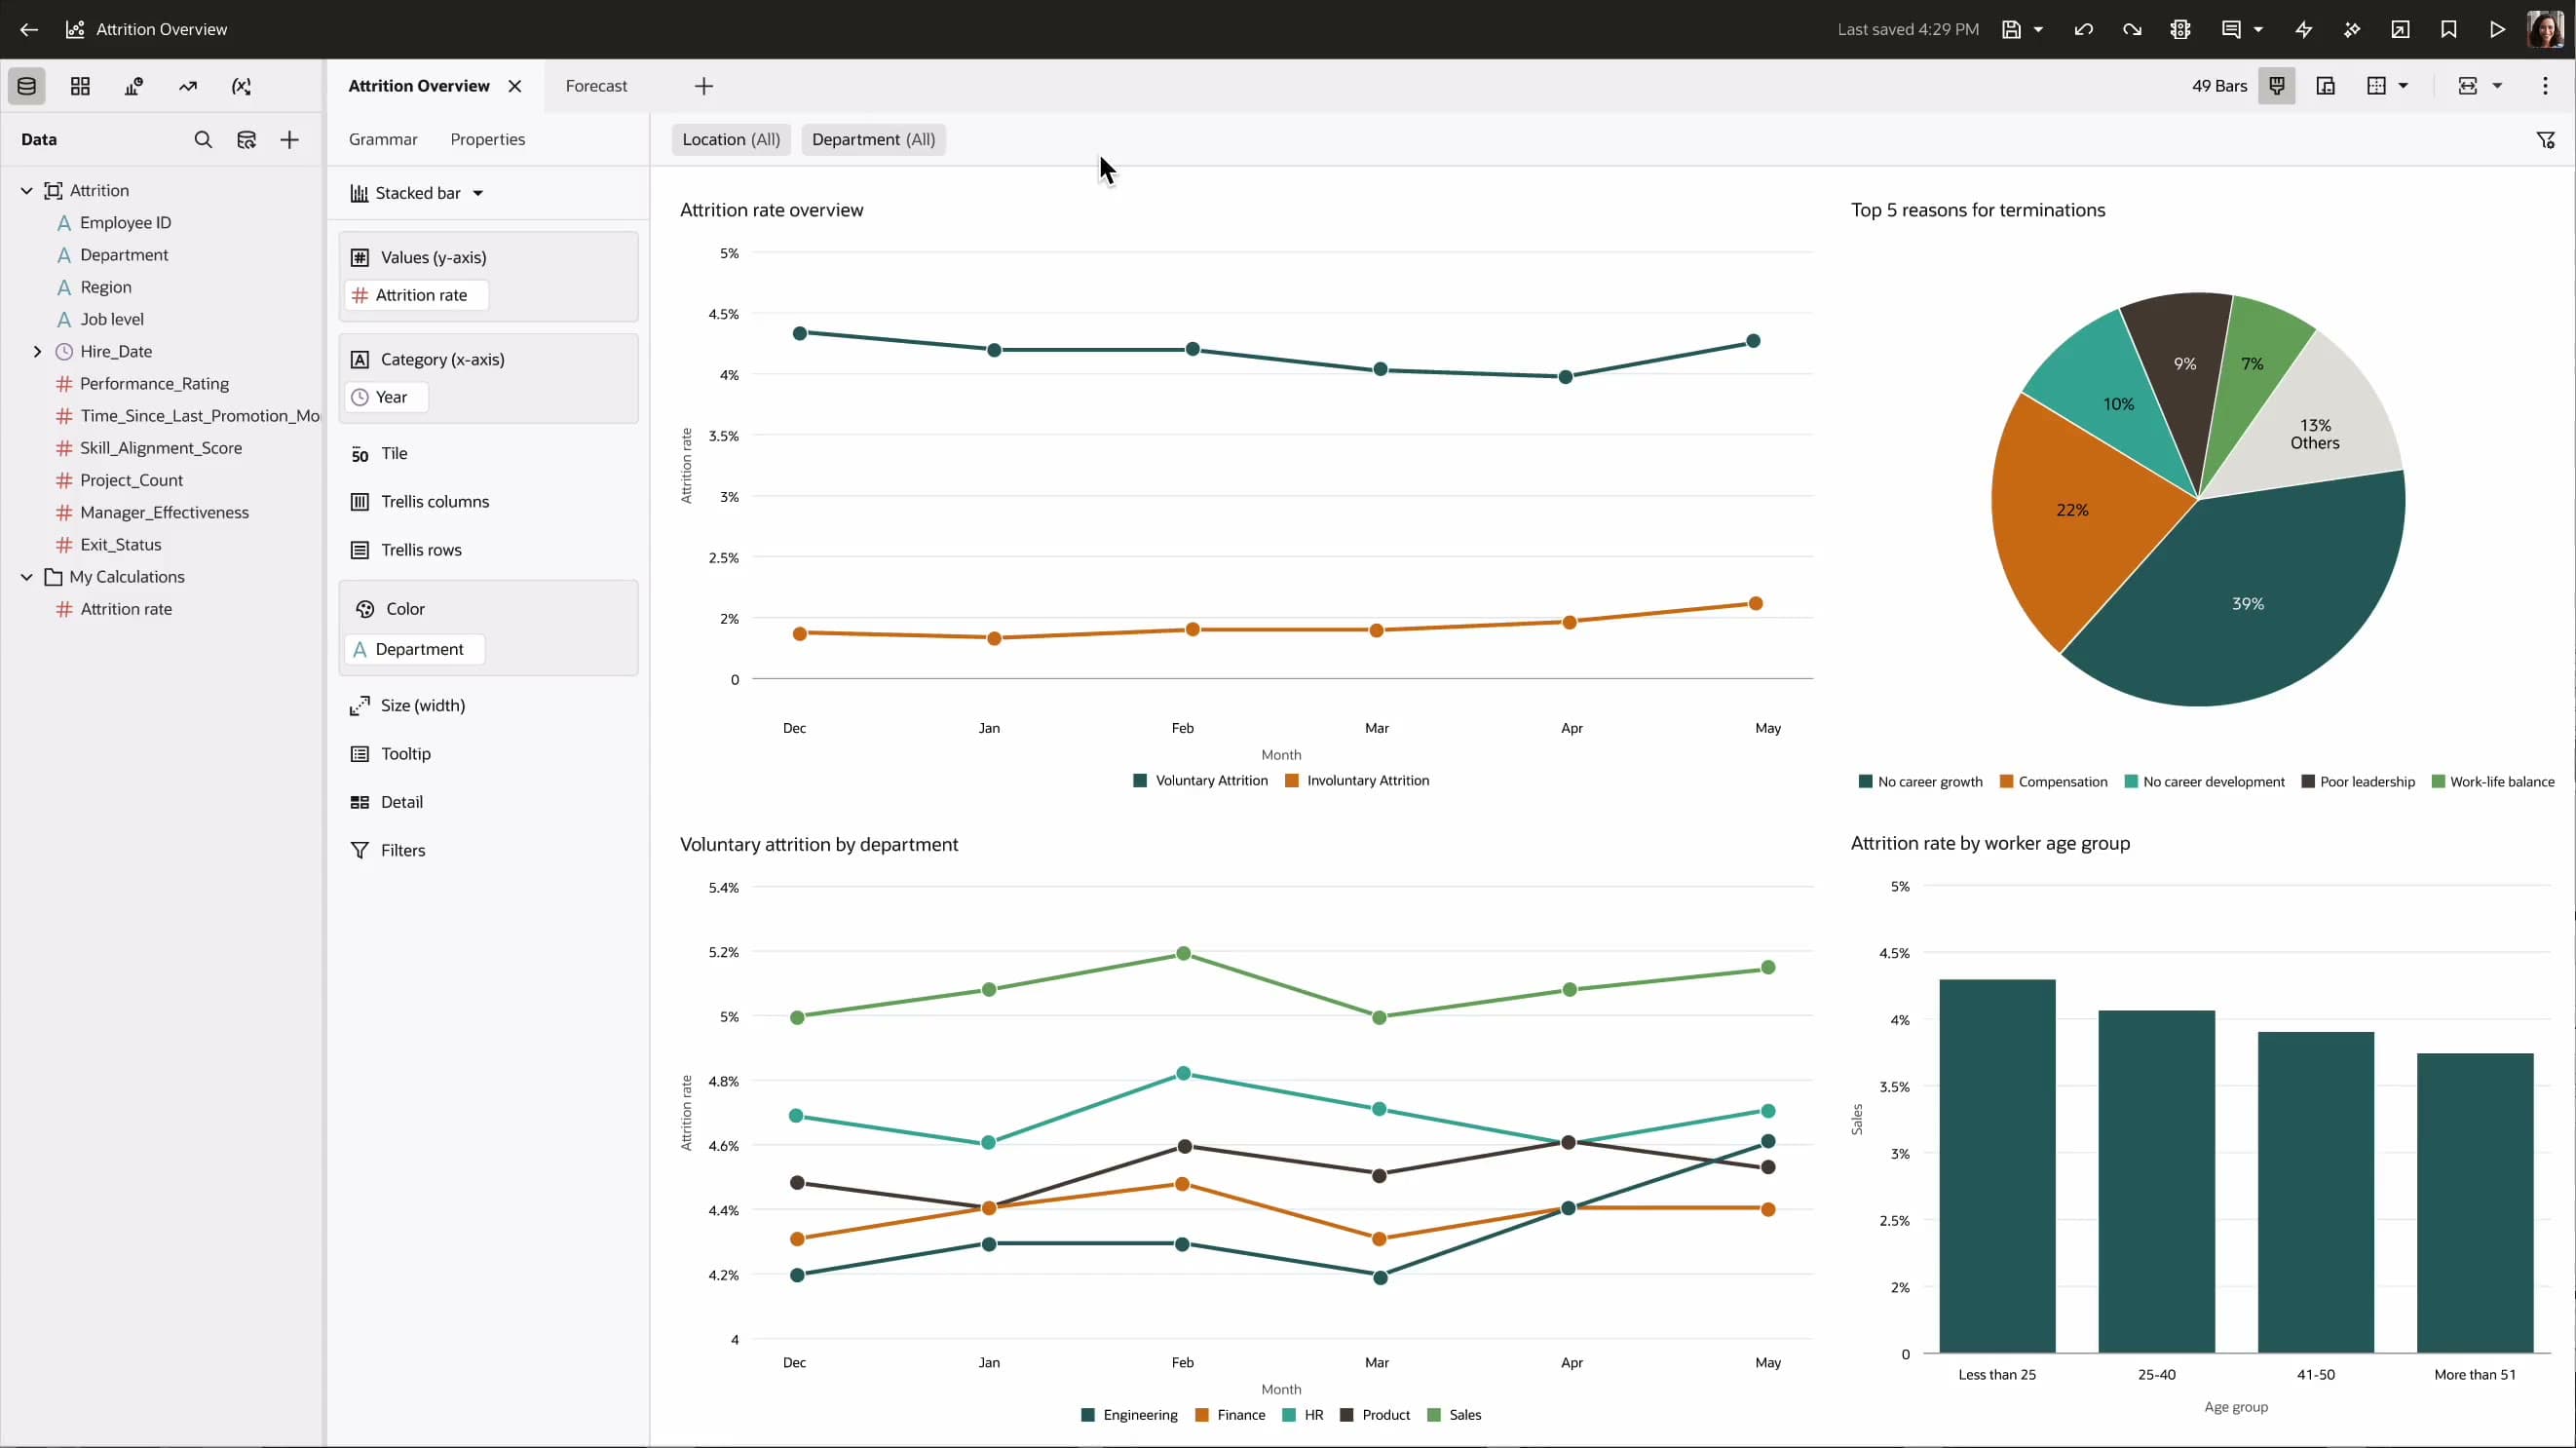
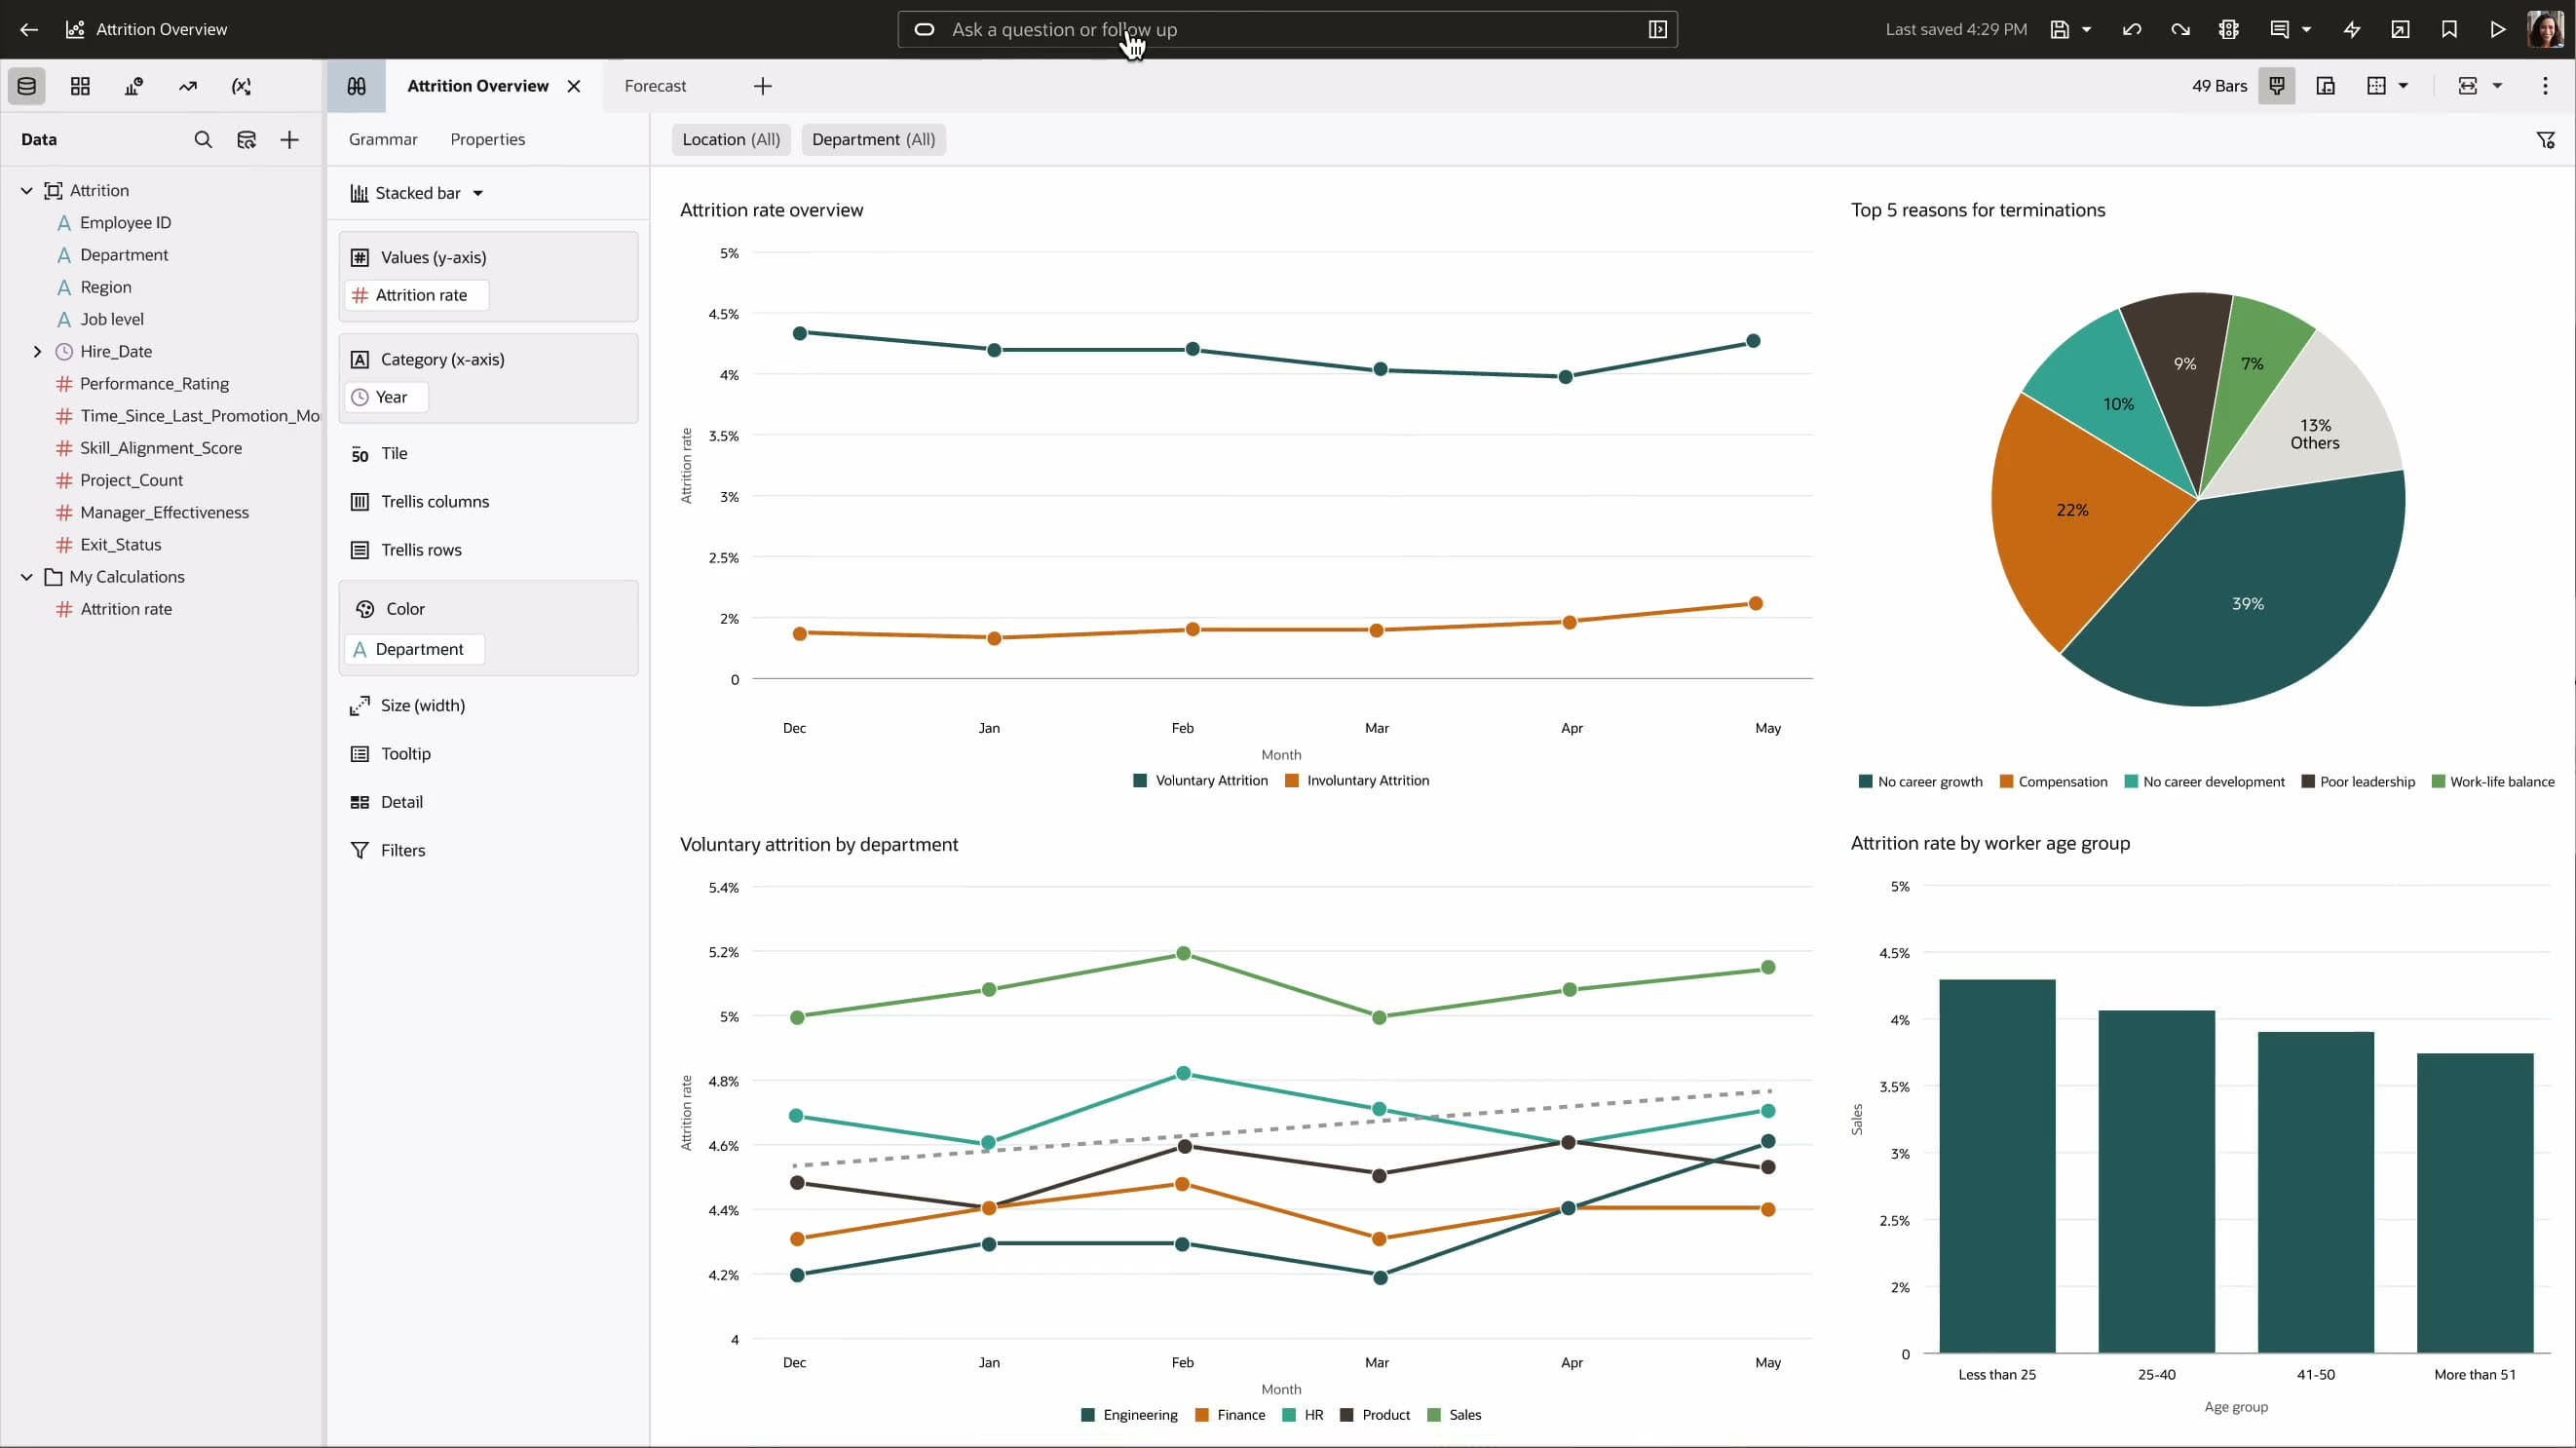
The redesigned system — AI detects intent from the query and routes to the right surface. The canvas stays uncluttered until assistance is needed.

The question I couldn't stop asking

Why do six AI features add up to zero strategy?

01 — The Problem

Six AI features. Zero coherent strategy. Analysts couldn't find what they needed — or know it existed.

Challenges

  • 6 disconnected AI features built independently — not designed to work together.

  • Pro-grade complexity in a BI tool already constrained by screen real estate.

  • Assistance felt bolted-on: not discoverable, not core to the experience.

Goals

  • Consolidate 6 patterns into a cohesive, harmonious system.

  • Orchestrate AI around user tasks and intent — not a single generic solution.

  • Preserve and improve all existing functionality. No feature loss.

02 — Analysis

Mapping intent to build an orchestration strategy

40+ queries analyzed across real analyst sessions — every one maps to 3 intent modes.

What's driving attrition?Profit for last yearHow do I change the series color?Explain data pointAdd a reference lineHighlight Q2 dataStack data by regionMake title bold and blueMove the legend to the topSet chart background to light grayShow timeline between Jan and JulyHow do I interpret this viz?Why isn't this calc expression working?What's driving attrition?Profit for last yearHow do I change the series color?Explain data pointAdd a reference lineHighlight Q2 dataStack data by regionMake title bold and blueMove the legend to the topSet chart background to light grayShow timeline between Jan and JulyHow do I interpret this viz?Why isn't this calc expression working?
Are hourly employees leaving at a higher rate than regular employees?What caused the spike in sales?How does discount influence sales across my managers?What factors contributed to this unexpected spike in spend?Is there a strong or weak correlation between these data points?What are the most important fields in this dataset?What is the relationship between these columns?Are hourly employees leaving at a higher rate than regular employees?What caused the spike in sales?How does discount influence sales across my managers?What factors contributed to this unexpected spike in spend?Is there a strong or weak correlation between these data points?What are the most important fields in this dataset?What is the relationship between these columns?
Make me a dashboard explaining attrition over time, by gender, and by reason for leavingCreate a bar chart for sales by yearMake a workbook allowing users to explore trends and key factors of airline delaysCreate a parameter that allows users to switch between monthsMake a reference line for the rolling average sales of the last 90 daysMake a KPI card for production attainment for the last 7 days with a reference line at 95%Create a dropdown to switch between total revenue, profit, or number of ordersMake me a dashboard explaining attrition over time, by gender, and by reason for leavingCreate a bar chart for sales by yearMake a workbook allowing users to explore trends and key factors of airline delaysCreate a parameter that allows users to switch between monthsMake a reference line for the rolling average sales of the last 90 daysMake a KPI card for production attainment for the last 7 days with a reference line at 95%Create a dropdown to switch between total revenue, profit, or number of orders

Every query maps to one of 3 intent modes

Answer

Quick, contained responses

Profit for last yearExplain data pointHow do I change the series color?How do I interpret this viz?Why isn't this calc expression working?What is the relationship between these columns?

Explore

Open-ended analysis

What's driving attrition?What caused the spike in sales?What factors contributed to this spike in spend?Are hourly employees leaving at a higher rate?Is there a strong or weak correlation here?How does discount influence sales across managers?

Create & Edit

Build and modify content

Create a bar chart for sales by yearAdd a reference lineMake a KPI card for production attainmentCreate a dropdown to switch between metricsMake me a dashboard for attrition over timeMake a reference line for rolling average sales
We discovered there are 3 main things users are trying to do:

  • Get answers to their questions
  • Explore their data, understand what it means.
  • Create and edit dashboards, visualizations, reports.
Profit for last yearHow do I change the series color?Explain data pointWhat's driving attrition?
Transactional answersDeep exploration
Add a median reference lineCreate a bar chart for sales by yearMake me a dashboard explaining attrition over time, by gender, and by reason for leaving
SpecificBroad

03 — The Hypothesis

The question

One panel that does everything, or intent-based routing to the right pattern?

The reasoning

The research made it clear: a generic assistant creates cognitive overhead because users have to translate their specific need into a chatbot format. Routing by intent — Answer, Explore, Create — means the right interaction surface appears before the user has to ask for it. The AI meets the analyst in their workflow, not the other way around.

The 3 intent modes

Answer

Specific question → direct, contained response

Explore

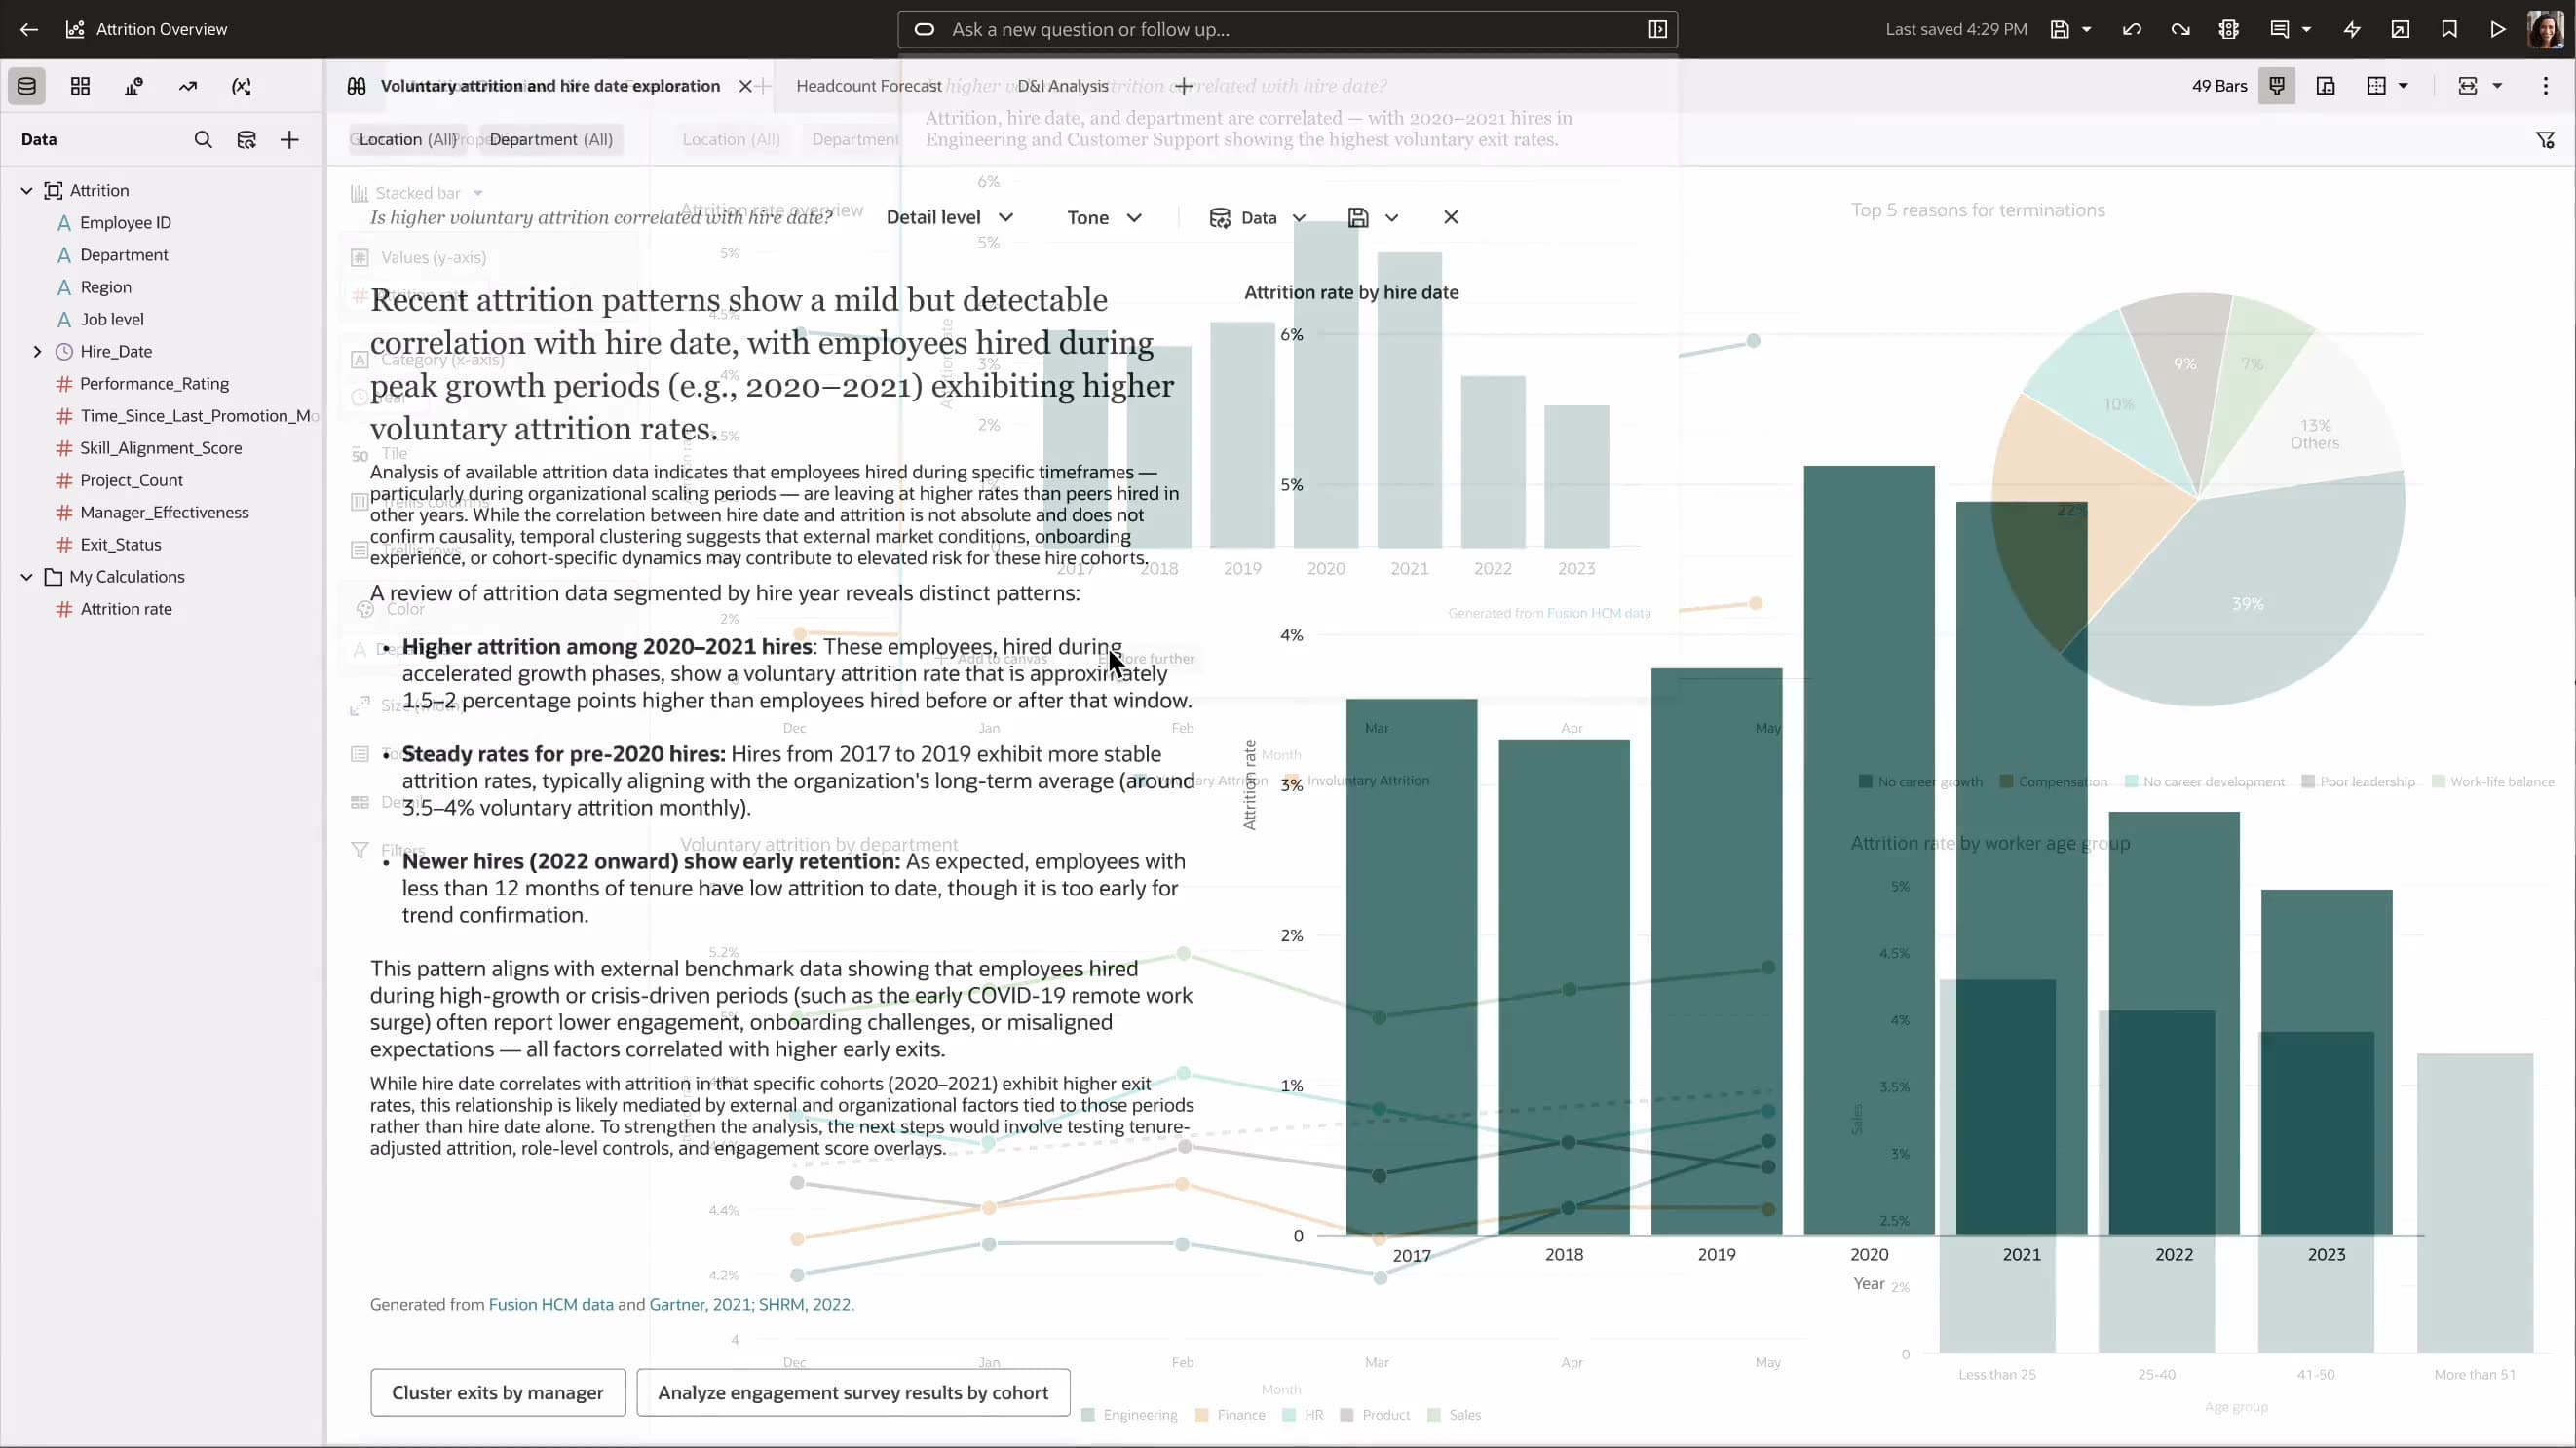
Open-ended → dedicated space for deeper analysis

Create & Edit

Manipulation → inline, contextual assistance

04 — The Work

Designing the orchestration system

01

Discover

Pulled 40+ natural language queries from design reviews, observed sessions, and engineering discussions. What struck me immediately: the same user need would arrive three different ways depending on which feature they happened to find first.

02

Categorize

The first taxonomy had five modes. It collapsed to three when I realized 'format changes' and 'structural builds' were the same intent — manipulation. That simplification unlocked the entire design logic.

03

Orchestrate

Designed the routing layer that detects intent and surfaces the right pattern. The harder problem: making 'consolidation' legible to stakeholders who assumed it meant cutting features.

The 6 existing patterns — before consolidation

Today, those needs are solved through 6 different features and patterns.

Assistant

01

Assistant

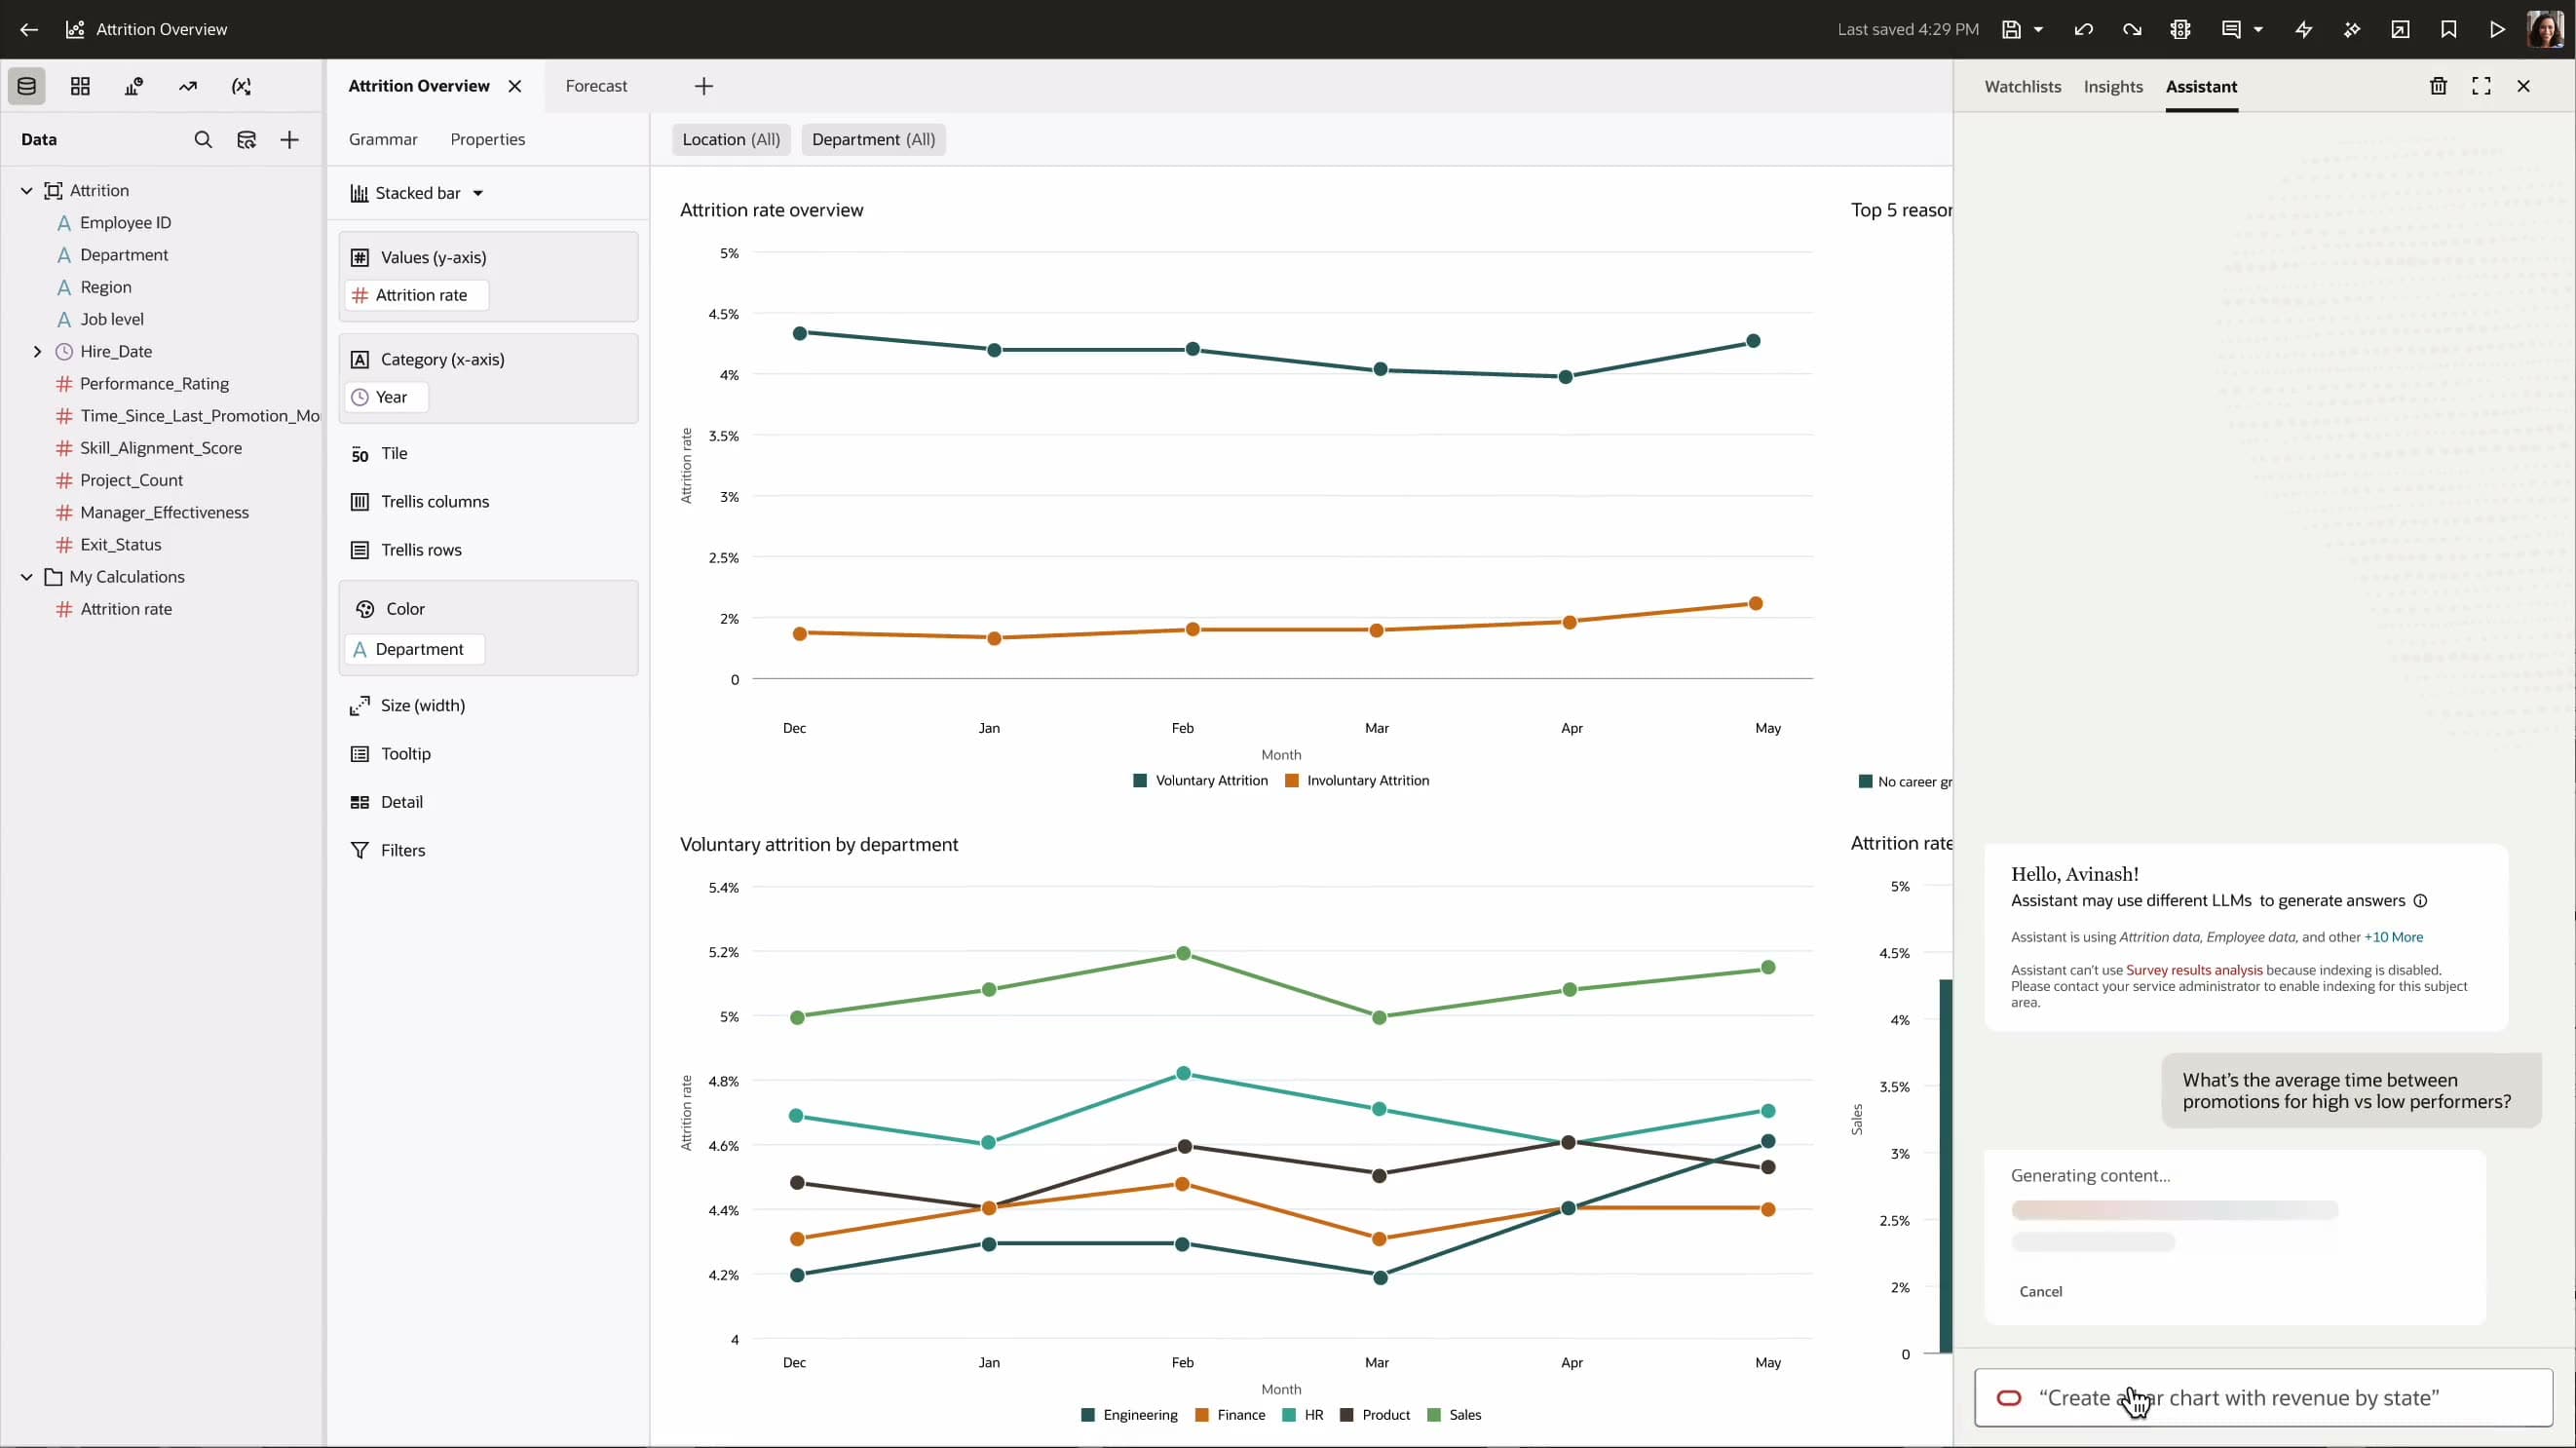
A side panel that overlays the data content. Always visible, even when not needed.

Standalone Ask

02

Standalone Ask

A dedicated page for NL queries. Separated from the data, breaking user flow.

Contextual Insights

03

Contextual Insights

AI-generated insights surfaced inline on dashboards. Powerful but inconsistently placed.

Targeted Commands

04

Targeted Commands

Point at any element to trigger AI on it. Useful, but yet another siloed pattern.

Explain

05

Explain

One-click explanation of data points and anomalies. Useful but treated as an isolated feature.

Auto Insights

06

Auto Insights

Proactive pattern detection surfaced automatically. Often ignored — no clear entry point.

05 — The Design

From feature sprawl to intent-based orchestration

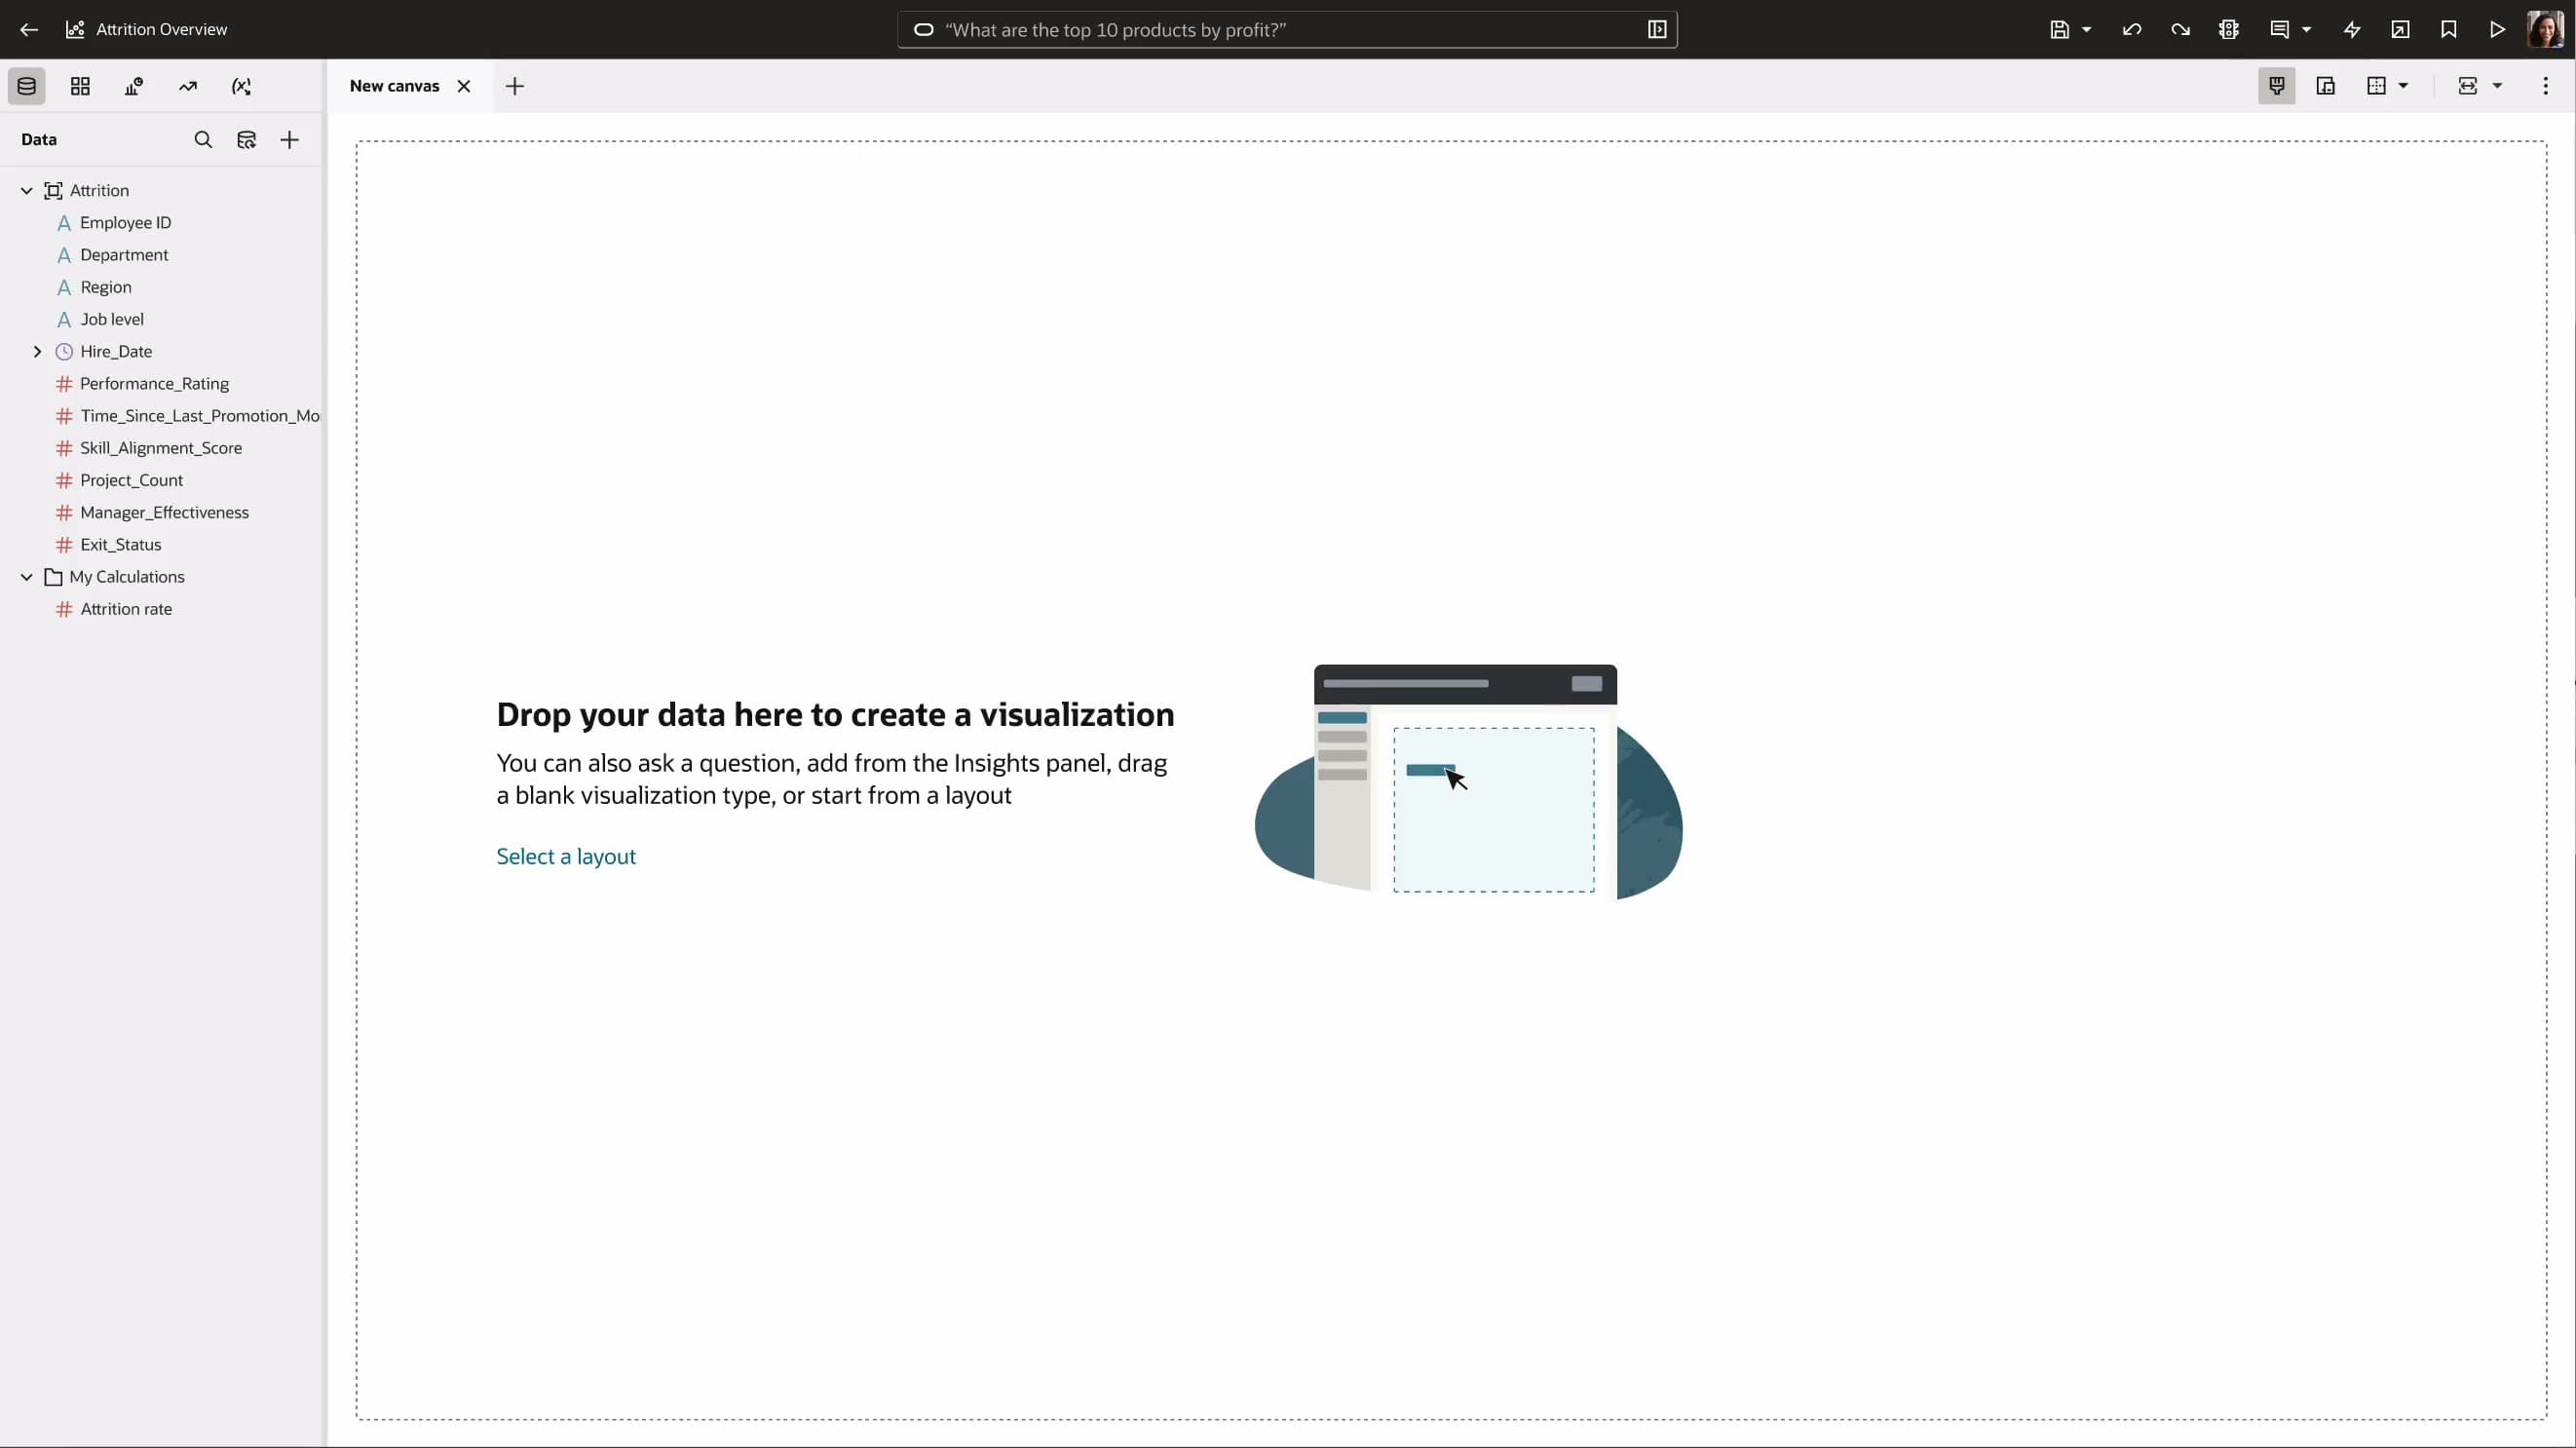
The problem wasn't any one feature — it was the absence of a system. Each AI capability had been built independently, with no shared logic about when it should appear or why. Analysts were forced to navigate between surfaces, often not knowing which one to use.

The intent taxonomy changed the frame. Once every analyst query mapped to one of three modes — Answer, Explore, or Create & Edit — the design logic became clear: don't surface everything always. Route to the right pattern based on what the analyst is actually trying to do.

01

Meet analysts in their workflow

AI assistance should appear where work is already happening — not require a detour to a separate surface.

02

Match the surface to the intent

A factual question deserves a quick inline answer. An open-ended exploration deserves dedicated space. The surface should reflect the task.

03

Consolidate, don't cut

Every existing AI feature maps to one of the three modes. Nothing is lost — everything is reorganized into a coherent system.

Before

Six disconnected AI surfaces — no shared model, no discoverability

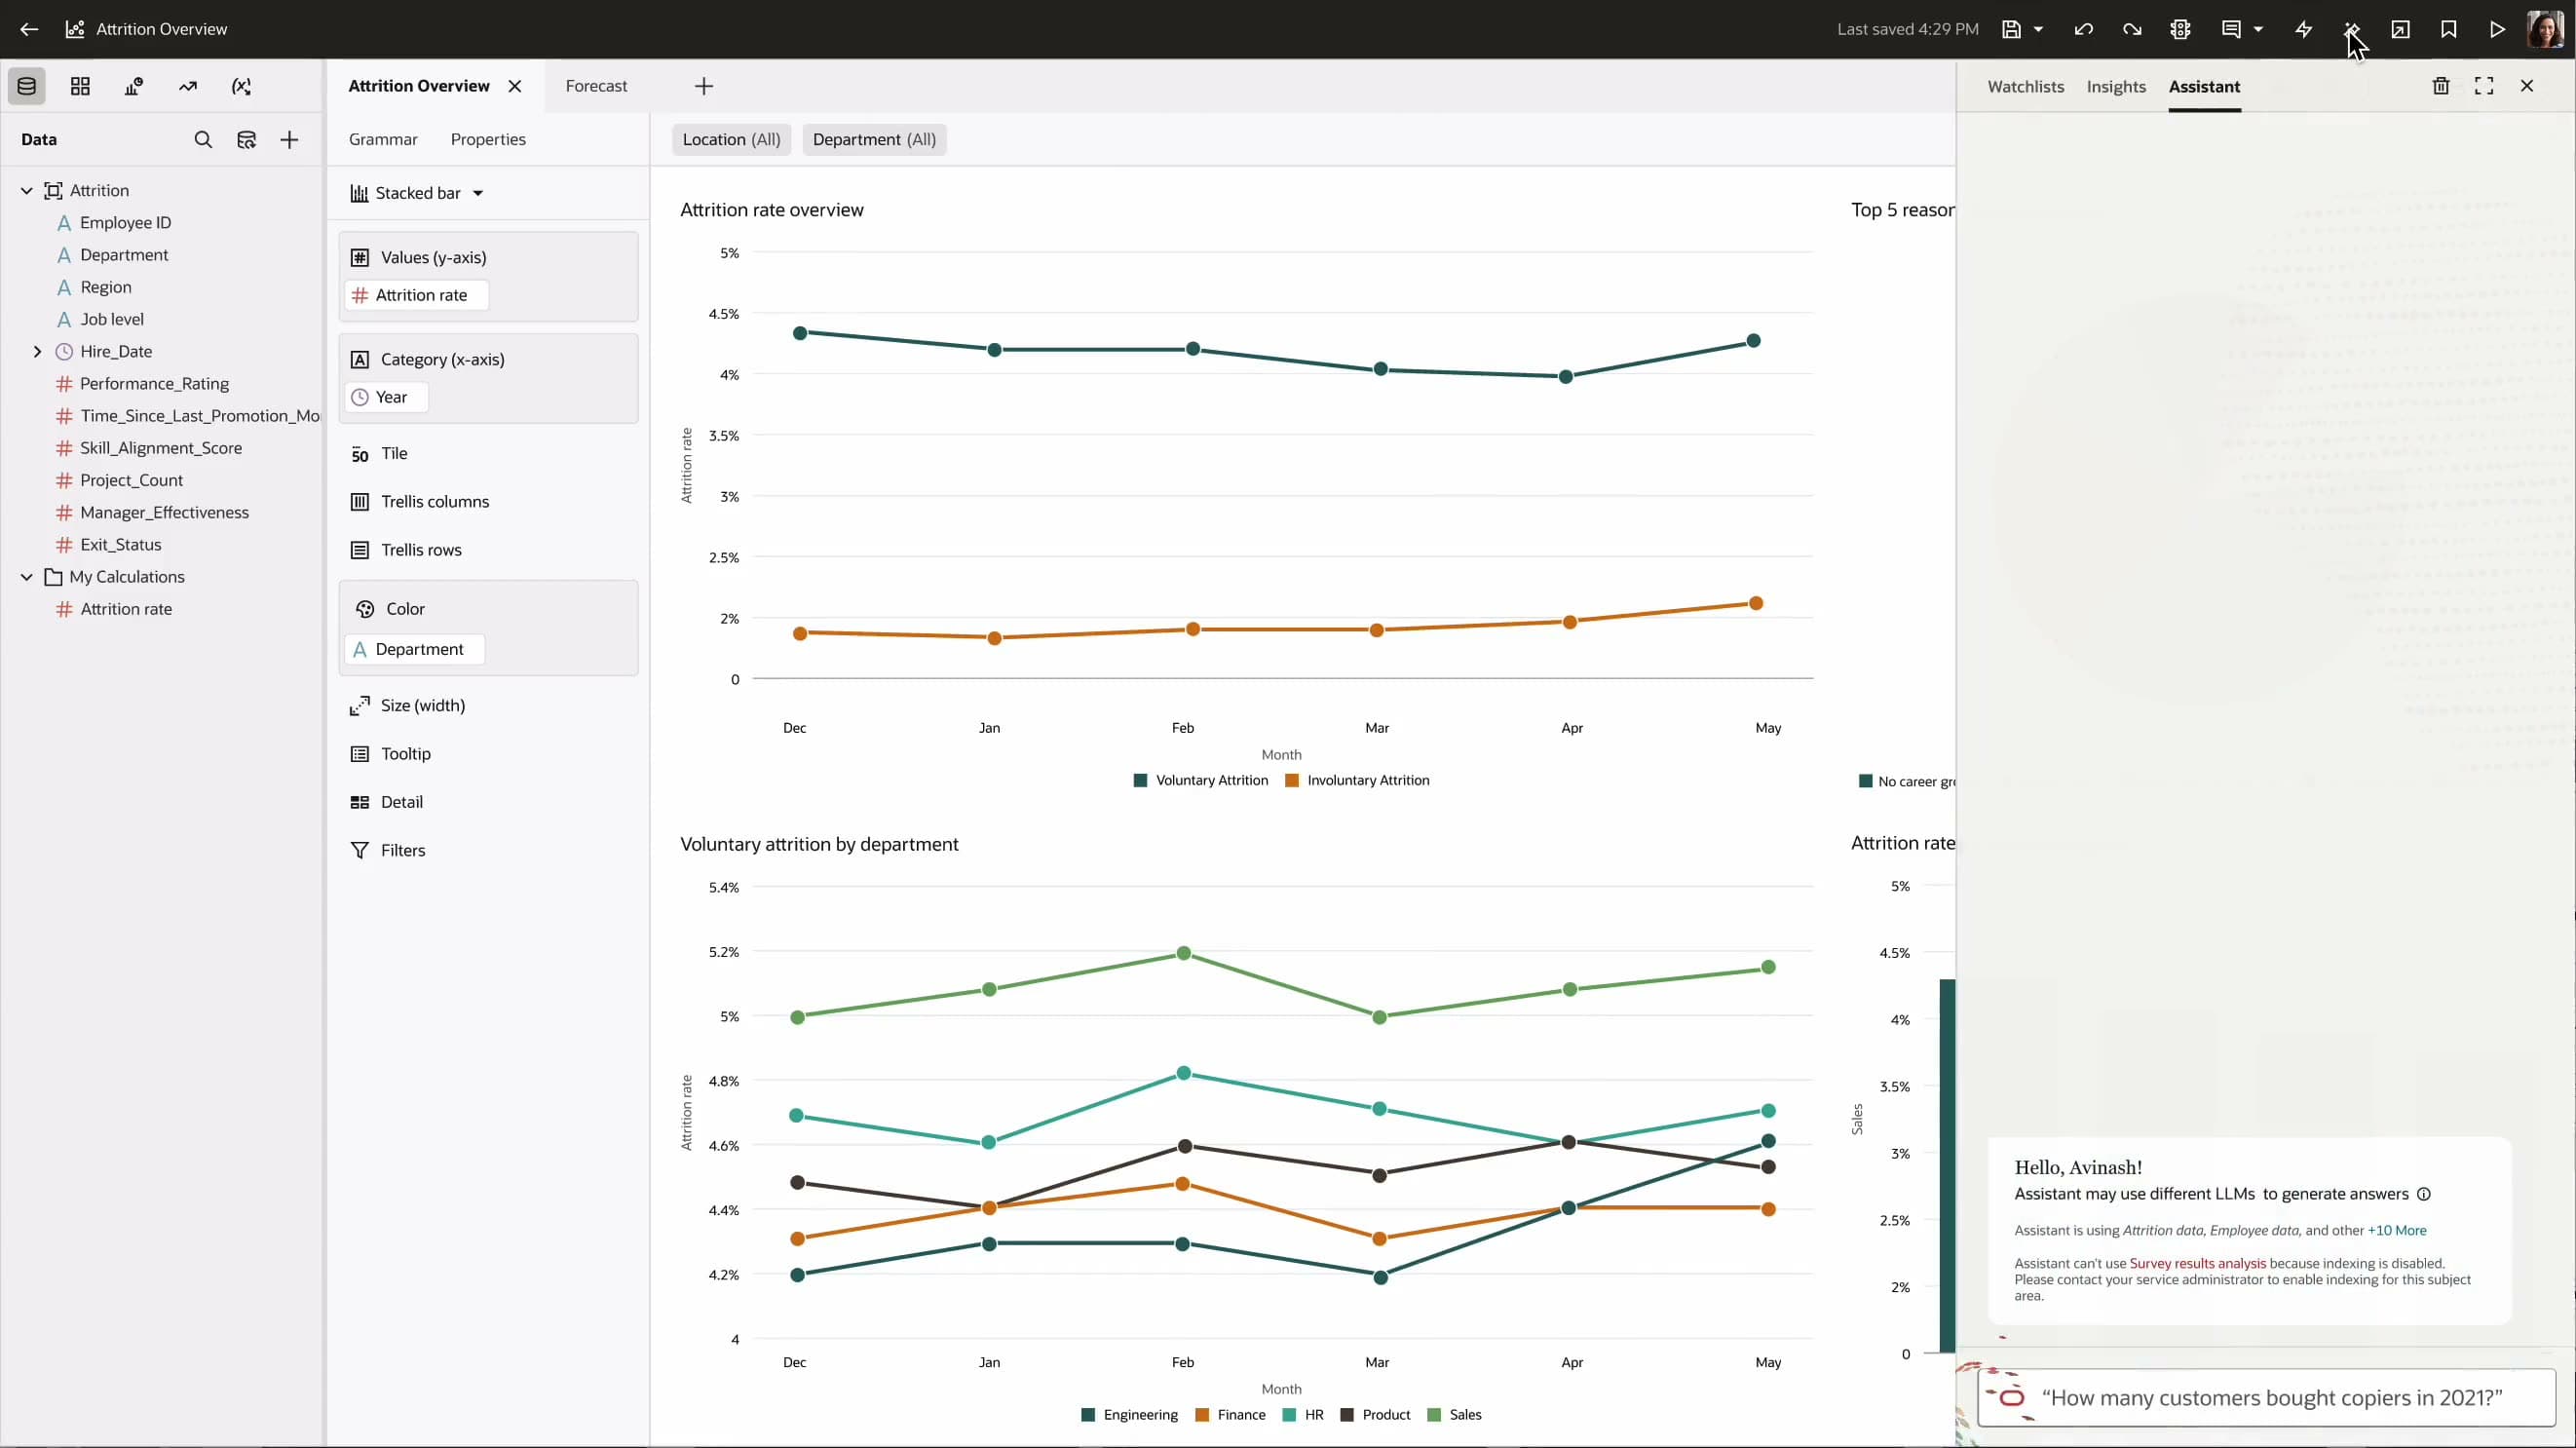
A persistent chat panel competes with the canvas — visible even when the analyst isn't using AI.

No signal to guide users toward the right surface for their specific task.

Features feel bolted on. Each one a separate interaction model, a separate entry point.

After

Intent-based orchestration — one system, three modes, right surface every time

AI detects intent from the query and routes to the right pattern — Answer, Explore, or Create & Edit.

The interface stays clean until AI is needed. Assistance surfaces in context, not on top of the work.

One coherent model across all AI features. Analysts learn it once and it works everywhere.

06 — The Outcome

2

New patterns added to the roadmap

Both net-new — not retrofits of what already existed.

6→3

AI patterns consolidated into intent modes

Every existing feature preserved — reorganized, not removed.

3

Analytics apps aligned to one model

The intent taxonomy became the shared reference across the suite.

  • Strategy approved and two patterns formally added to the product roadmap.

  • Established a shared interaction model now used as a reference across Oracle Analytics — subsequent features are spec'd against it.

  • The '3 modes' frame became the vocabulary PMs, engineers, and designers use when talking about AI in the product.

07 — Next

Next project

People Leader Scenario Modeling

View project →